
THE APEX TIMES
Mets pitcher McLean’s curve climbs Baseball Savant’s new miss-distance leaderboard
Major League Baseball’s Statcast measurement upgrade adds swing-timing and “miss distance” to its pitch-type evaluation, letting fans and teams quantify just how far off target a batter is when they swing and miss. In the first look at the expanded data, McLean’s curve stands out as one of the nastiest offerings on the leaderboard.
Major League Baseball has expanded its Statcast pitch analysis toolkit, and the first major leaderboard built on the update spotlights a simple, punishing question: when hitters chase, how far are they missing the ball? MLB’s new swing timing and miss-distance view on Baseball Savant turns “a lot” into an exact measurement, and it has already produced a standout at the top of the early pitch-type rankings.
The update centers on miss distance, a Statcast-based way to measure the physical gap between where a batter’s swing ends up and where the pitch crosses the plate area. MLB explains that the addition of swing-timing context makes the leaderboard more informative than raw whiff totals alone, because it distinguishes between swings that were early, late, or simply off-target in space.
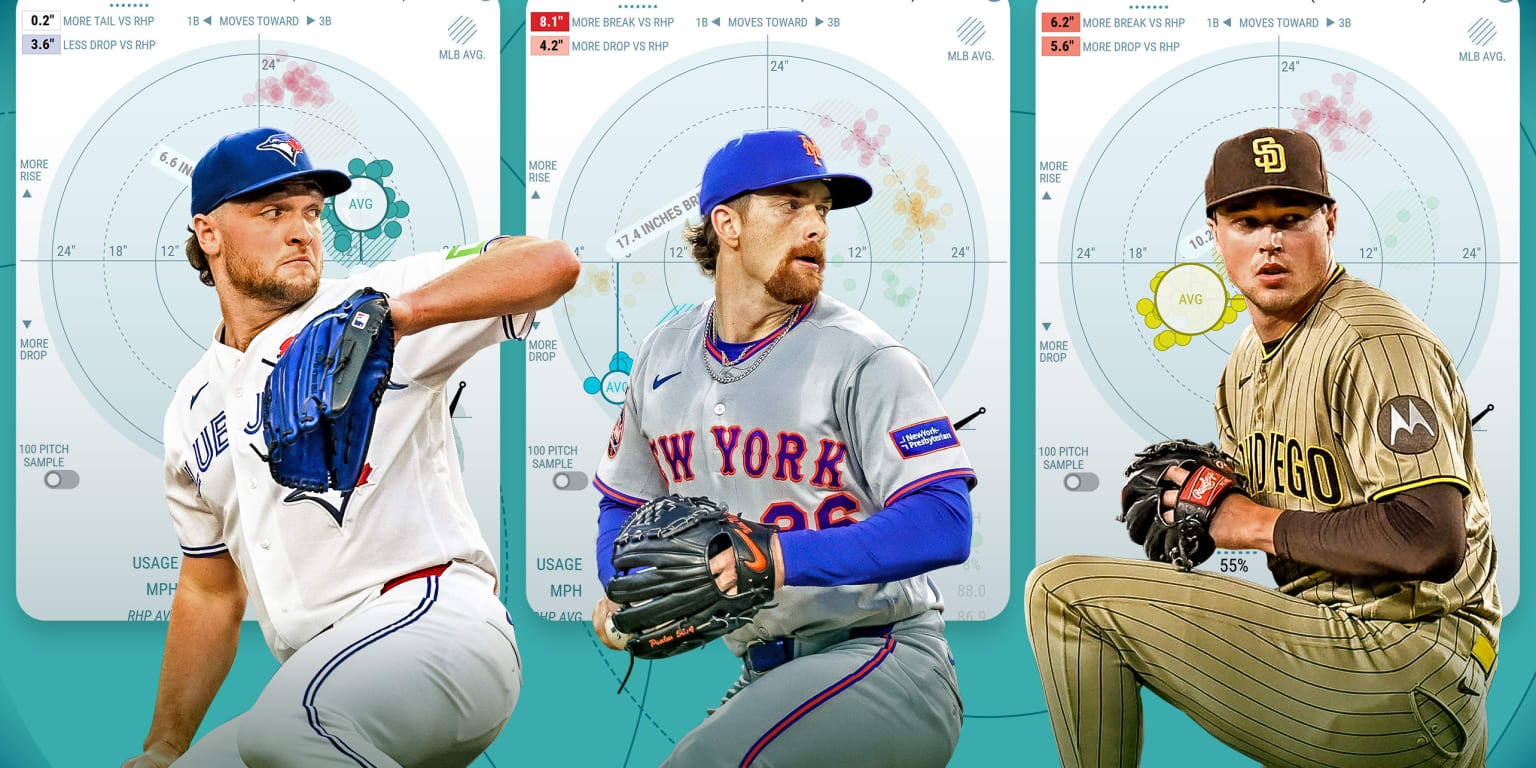
In MLB’s analysis, Mets pitcher McLean’s curve is featured as one of the nastiest pitches in baseball on the new miss-distance leaderboard. The framing matters: “nastiest” in this context is not just about inducing a miss, but about producing misses that are both frequent and meaningfully away from contact. The curve’s profile, as presented by MLB analysts, is tied to how batters appear to be solving it, then still failing to get anywhere near the ball.
MLB’s accompanying explainer, written by Mike Petriello, emphasizes what the new leaderboard makes possible for the baseball ecosystem. For teams, it provides a clearer way to compare pitch effectiveness across pitch types and to evaluate whether a pitcher’s results reflect genuine pitch behavior rather than sequencing, favorable counts, or small-sample variance.
For hitters and coaches, the same lens can also inform preparation. If a curve is generating large miss distances, it suggests that even when batters commit to the swing, the pitch is arriving at a spot or with a movement pattern that consistently moves the batter off the barrel region. In practical terms, that can raise the difficulty of making contact and can force sharper decisions on when to offer at pitches out of the strike zone.
There is also a caveat in how quickly this kind of leaderboard should be interpreted. Any early-season or early-release ranking can be influenced by sample size, park effects, and the distribution of opponents and counts faced by the underlying pitchers. Still, the change in measurement is meaningful, because it offers a repeatable way to compare pitches based on what batters actually experience at the moment of the swing.
What to watch next is whether the leaderboard broadens beyond this initial set of featured pitchers and how often curves, sliders, and other breaking types continue to dominate on miss distance rather than whiff rate alone. If it holds, teams may lean even harder into pitch shapes and release mechanics that maximize “distance from the ball” outcomes, not just strikeout outcomes. For the Mets, having McLean’s curve highlighted at the top provides a tangible analytic confirmation of what scouts often try to describe in softer terms.
McLean’s curve, by MLB’s own framing, is an example of how modern Statcast can quantify the “wow factor” behind a pitch. Instead of relying on description alone, Baseball Savant’s new view supplies a measurable answer to how far off target batters are when they swing and miss, and that may reshape how pitchers, hitters, and coaches talk about pitch quality going forward.
Why It Matters
- Quantifying miss distance gives teams a sharper tool for comparing pitch types and evaluating whether effectiveness comes from true pitch behavior.
- Hitters can use the metric as a preparation lens, especially when a pitch produces consistently large, off-target misses.
- Coaching strategies may shift toward pitches that maximize “off-target” outcomes rather than focusing only on whiffs or strike rates.
- For a club like the Mets, an analytic spotlight on a specific breaking pitch can influence how they plan sequences and pitch usage in high-leverage at-bats.
Sources
Key Facts
- MLB highlighted new Baseball Savant leaderboards that incorporate swing timing with Statcast “miss distance.”
- Miss distance measures how far batters are from making contact when they swing and miss.
- The updated approach is designed to turn vague assessments of pitch nastiness into quantifiable results.
- In MLB’s initial leaderboard look, Mets pitcher McLean’s curve is featured among the most damaging pitches by miss distance.
- MLB’s analysis was explained by Mike Petriello as part of the rollout of the updated Statcast pitch metrics.